Advancing South India’s Global Agenda

Budget 2026-27: How does South India fare: Kalaiyarasan A. and Rhwithwik M S
BackBudget 2026-27: How does South India fare: Kalaiyarasan A. and Rhwithwik M S
Issue Brief No: 1Budget 2026-27: How does South India fare
Authors: Kalaiyarasan A. and Rhwithwik M S
Coming in the context of a great global uncertainty when the world economic order has been upended, India’s Union Budget 2026-27 has important implications for the export sectors, particularly electronics, garments and leather, some of them already reeling under external shocks such as the Trump tariffs. The budget also assumes significance as the fiscal year 2026–27 will mark the beginning of awards under the 16th Finance Commission (FC), which has implications for fiscal federalism, as many South Indian states have long-standing concerns about impact of fiscal allocations.
While budgetary allocations impact the wellbeing of every citizen in the country, they affect states differently, as level of economic development and standard of living vary across states. Despite the overall architecture of governance, fiscal arrangements, and macroeconomic policies being common to all states, the southern states—comprising Andhra Pradesh and Telangana, Karnataka, Kerala, and Tamil Nadu—have been growing faster than the rest of India. High economic growth in the southern states has also been accompanied by improved human development outcomes as they rank among the top 10 in the country in terms of the Human Development Index, thanks to early investments in education and health.
Besides a few inherited advantages, the southern states have been able to grasp the new opportunities offered by the opening of the economy since the 1990s. Leveraging the market-oriented economic reforms accompanied by industrial deregulation, these states have formed their own investment promotion agencies in order to attract private investment. State-level institutions mattered as the quality of governance is a key in implementing these policies and shaping development outcomes. Moving beyond the traditional indicator of fiscal capacity i.e., the tax–GDP ratio, Economic Survey 2025-26 notes, for the first time, that state capacity—the ability of institutions to intervene in the economy—matters. Differences in state capacity thus account for variations in the effectiveness of public investment and implementation of socio-economic policies.
As a result of these cumulative interventions, the economic structure of these states differs significantly from others. Southern states are more urbanised, with a relatively higher share of manufacturing. With higher enrolment in higher education, these states tend to have more educated women and a larger share of women’s participation in the labour market. These five states account for about 68% of total women working in factories, with Tamil Nadu alone accounting for 43%. Southern states also disproportionally contribute to India’s exports earning foreign reserves. Their contribution to all-India metrics exceeds their population share. They account for about 30% of GDP, nearly 65% of software exports, around 29% of India’s merchandise exports, about 30% of manufacturing output, and about 35% of total factories in India.
Hence, national policies, including the Union budget, need to account for these differences in growth mechanisms, levels of development, and governance needs. Infrastructure requirements also differ, given the higher rates of growth. Small changes in trade and macroeconomic policy can therefore have large consequences. Furthermore, the institutional architecture has changed after the abolition of the Planning Commission as states no longer have a mechanism to articulate their sectoral concerns beyond the budgetary process.
Table 1: South India’s Contribution to National Economy
|
Economic Indicators |
Andhra Pradesh |
Karnataka |
Kerala |
Tamil Nadu |
Telangana |
South India (Total) |
South India’s Share in India (%) |
|
Real GDP (₹ lakh crore) |
8.65 |
15.7 |
6.85 |
17.32 |
8.35 |
56.88 |
30.3 |
|
Real Manufacturing GVA (₹ lakh crore) |
1.05 |
2.28 |
0.79 |
3.77 |
0.91 |
8.8 |
29.8 |
|
Merchandise Exports (million USD) |
20782 |
30481 |
4772 |
52074 |
19123 |
127231 |
29.1 |
|
Software Exports (₹ crore) |
2850 |
409095 |
6303 |
80677 |
121117 |
619043 |
65.6 |
|
Operational Factories |
12305 |
11744 |
6982 |
32000 |
10503 |
73534 |
34.5 |
|
Factory Sector Employment |
769214 |
1232959 |
357911 |
2984439 |
911843 |
6256367 |
31.9 |
|
Female Workers in the Factory Sector |
115797 |
229014 |
83488 |
661739 |
35422 |
1125461 |
68.6 |
This budget has, as many commentators have noted, done better on fiscal prudence, with the fiscal deficit target set at 4.3% of GDP for 2026–27, lowering the debt-to-GDP ratio to 55.6% in FY27 from 56.1% in the current fiscal year. As argued in the Economic Survey, given the geopolitical crisis and tariff wars, there appears to be a shift in India’s approach to economic growth, particularly towards focusing on strategic sectors and strengthening manufacturing competitiveness and export resilience.
Figure 1: Expenditure in Major Items in Budget
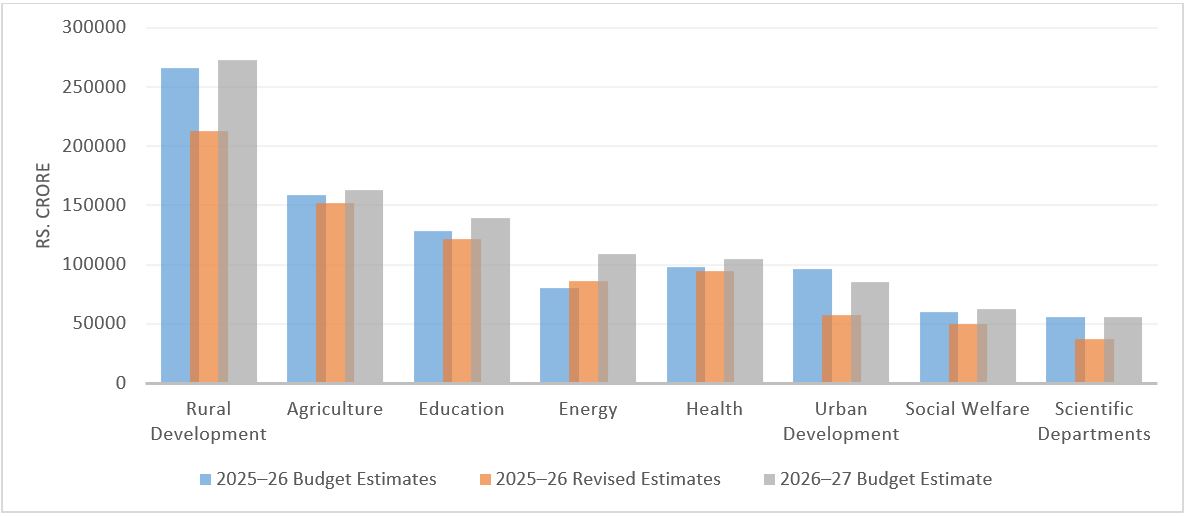
Source: Budget at a Glance, 2026-27
Boosting Manufacturing
As the Economic Survey notes, manufacturing competitiveness and exports are important for sustaining growth dynamism and also for currency stability in the uncertain world. The competitiveness, the survey suggests, will hinge on innovation, skilling, scaling up of MSMEs to embed India as a ‘high productivity manufacturing hub’. In that sense, the budgetary support for seven strategic sectors—semiconductors, electronic components, biopharma, chemicals, capital goods, and textiles—assumes significance. In particular, the outlay of ₹40,000 crore under the electronics component manufacturing scheme and Semiconductor Mission 2.0 would benefit states such as Tamil Nadu and Karnataka, which together account for about 50% of India’s electronics exports. Similarly, the push for MSMEs would certainly benefit the southern states, as they have a larger share of MSMEs in the country. The proposed ₹10,000 crore for SMEs would help scale up MSMEs. The proposed five-part integrated programme for the textile sector, including the National Fibre Scheme and Samarth 2.0 for skill modernisation, would significantly benefit southern states including Tamil Nadu, which is a leader in this sector and currently accounts for 22.58% of the country’s textile exports. The Budget also announced the establishment of a ‘Rare Earth Corridor’ connecting the mineral-rich states of Odisha, Andhra Pradesh, Tamil Nadu, and Kerala. This corridor, the budget document argues, will promote mining, processing, research, and manufacturing, helping India build leadership in critical minerals, and will certainly boost the southern states.
Similarly, since the high-end service sector led by IT and IT-enabled services—key to containing India’s current account deficit—is largely located in South India—Chennai, Hyderabad, and Bengaluru. The budget proposal to attract global cloud service providers such as Microsoft, Google, and Amazon would strengthen these states’ efforts to establish data centers, particularly in Andhra Pradesh. These states account for about 55% of Global Capability Centers in India. The announcement of seven additional high-speed rail corridors, of which three are exclusively for South India—Hyderabad–Bengaluru, Hyderabad–Chennai, and Chennai–Bengaluru—is also notable. The budget also introduces specialised eco-tourism projects, including Turtle Trails along key nesting sites in the coastal areas of Karnataka, Kerala, and Odisha, as well as bird-watching trails along Pulicat Lake in Andhra Pradesh and Tamil Nadu.
That said, these interventions seem disconnected from earlier initiatives such as the PLI and Employment-Linked Incentive schemes. Of the ₹1.97 lakh crore committed across 14 sectors, barely 12% has been disbursed, and very few firms have benefited. Apple’s contract manufacturers, located in the South, absorbed nearly three-quarters of mobile incentives. Similarly, the success of the ₹2 lakh crore package, promising 4.1 crore jobs, is yet to be seen.
Budget Allocation and Fiscal Federalism
The most contentious issue is the share in fiscal resources. Southern states have consistently demanded that the Finance Commission allocation be increased to 50%, yet devolution, recommended by the 16th Finance Commission, remains at 41%. The past experience suggests that even this share has not been actualised due to the growing collection of cesses and surcharges—excluded from the divisible pool. The effective share of states in the devolution has come down 33% for the last five years’ average.
Table 2: Inter se Share of States from 11th Finance Commission to 16th Finance Commission
|
State |
AP & Telangana (%) |
Karnataka (%) |
Tamil Nadu (%) |
Kerala (%) |
South India (%) |
|
11th FC (2000-05) |
7.7 |
4.9 |
5.4 |
3.1 |
21.1 |
|
12th FC (2005-10) |
7.4 |
4.5 |
5.3 |
2.7 |
19.8 |
|
13th FC (2010-15) |
6.9 |
4.3 |
5.0 |
2.3 |
18.6 |
|
14th FC (2015-20) |
6.8 |
4.7 |
4.0 |
2.5 |
18.0 |
|
15th FC (2020-26) |
6.2 |
3.7 |
4.1 |
1.9 |
15.8 |
|
16th FC (2026-31) |
6.4 |
4.1 |
4.1 |
2.4 |
17.0 |
Southern states have been raising concerns about their declining share in horizontal distribution. Their share in the divisible pool declined from 21.1% under the 11th FC to 15.8% under the 15th FC. The fact that this decline occurred in the context of constraining resources due to the rise of cesses and surcharges has generated political debates in the states. The 16th Finance Commission seems to have addressed this concern partially by reshuffling criteria and weights, increasing the share to 17%. Thanks to the introduction of additional criterion of 10% weightage for the contribution of a state GDP, some southern states have gained a partial rise in their share of devolution. Kerala’s share rose to 2.3% from 1.9% under the 15th FC, and Karnataka’s share increased to 4.1% from 3.6%. Andhra Pradesh also saw a marginal increase, while the shares of Telangana and Tamil Nadu remained unchanged. However, revenue deficit grants, along with state-specific and sector-specific grants, have been discontinued. This has an implication for south Indian states, in particular, which prioritise revenue expenditure on education and healthcare. This continuation comes against the backdrop of the Centre pushing greater financial responsibility onto states for implementing Centrally Sponsored Schemes (CSS), such as the Viksit Bharat—Guarantee for Rozgar and Ajeevika Mission (Gramin), which replaced the Mahatma Gandhi National Rural Employment Guarantee Scheme. By requiring states to spend more on CSS and often linking fund releases to specific policy prescriptions, the Centre continues to exert considerable influence over states’ expenditure decisions.
The Tariff, Export and Lock-in Effect
As we write this piece, India has finally clinched its trade deal with the US. It is expected that US reciprocal tariffs on Indian goods will come down from 50% to 18%. However, besides these interventions, MSMEs are reeling under stress. The earlier penal tariffs imposed by the US had disproportionately affected these enterprises. Sectors such as textiles, seafood, leather, shrimp, and footwear were significantly impacted. Margins in these sectors were already razor-thin, and the tariffs pushed many towards extinction by disrupting supply chains at a time when they were slowly recovering from demonetisation and the COVID-19 pandemic. The sudden collapse in orders triggered cascading effects—not only displacing workers but also weakening local economies built around these industries. Once disrupted, such supply chains are difficult to rebuild. The impact extended beyond direct exporters to transporters, logistics providers, food vendors, and other service providers. Some describe this as a lock-in effect—once an economy loses its market or ecosystem due to disruption of this scale, it becomes difficult to rebuild. Competitors such as China, Vietnam, Mexico, Turkey, and Bangladesh could gain at India’s expense. Now that the Trump tariffs are revoked, the effects on rebuilding have yet to be seen.
Figure 2: Merchandise Export in Billion USD, 2024-25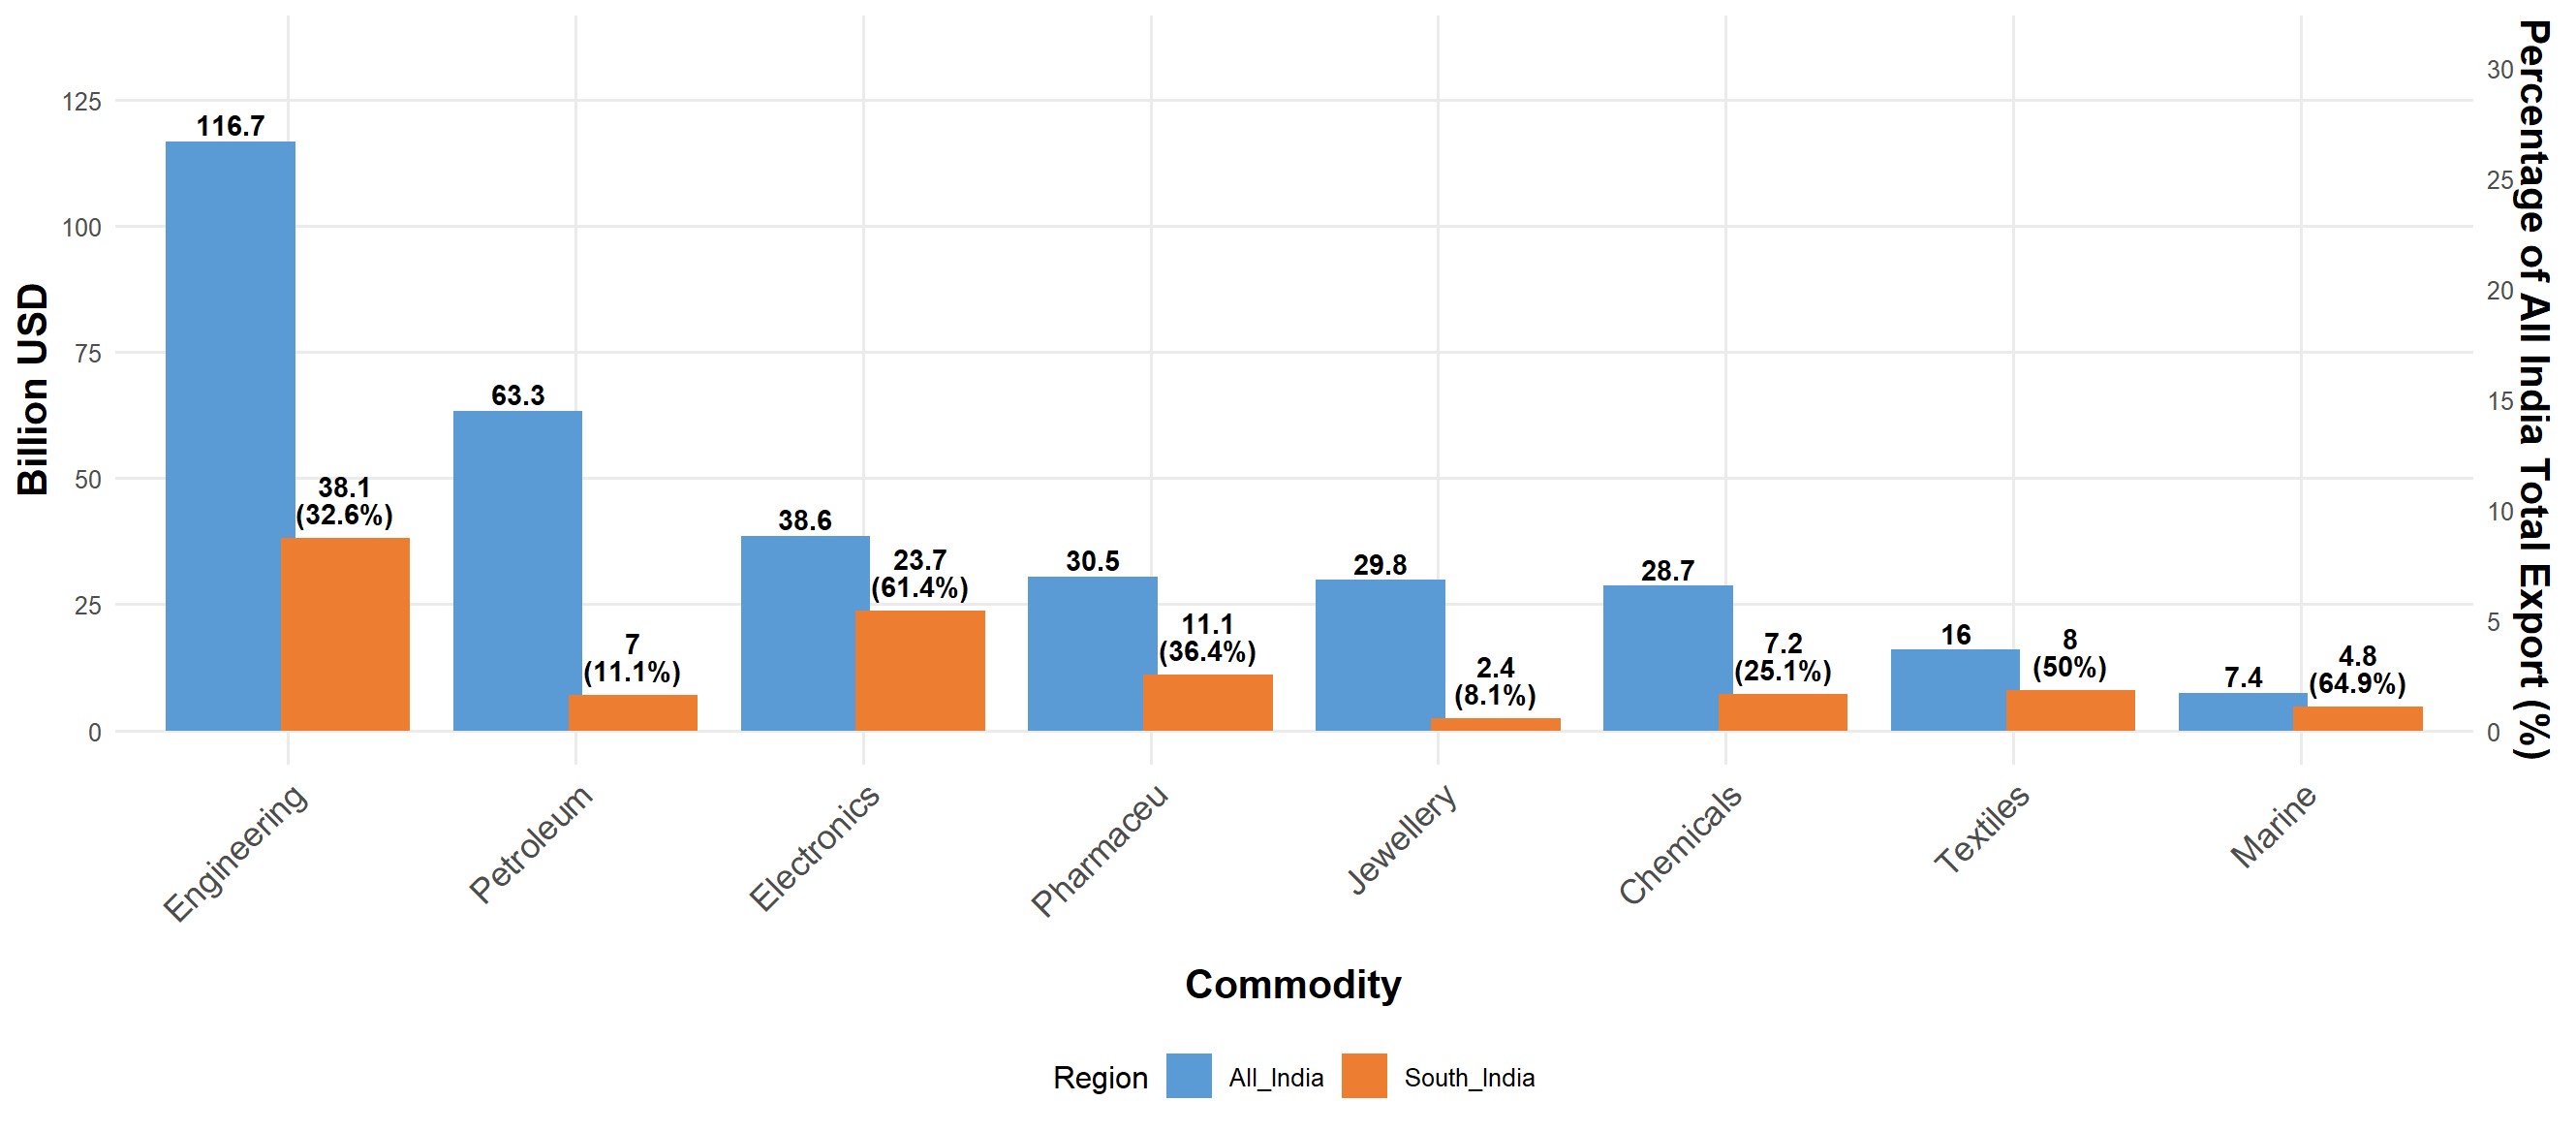
Source: National Import-Export Record for Yearly Analysis of Trade
This budget also comes in a context where India has signed a trade deal with the EU, which the EU has proclaimed as the “mother of all deals,” with a focus on labour-intensive manufacturing. It is only in this sector that India can design a strategy where import substitution and export growth reinforce each other. As of now, sectors such as leather, textiles, and garments together account for less than 5% of India’s total exports, even as India’s trade deficit with China continues to widen. While credit-focused solutions are important, MSMEs face a different set of problems. Poor technology diffusion and the lack of integration between MSMEs and large firms remain the core constraints to their upgradation. While renewed trade ties with both the US and the EU offer India an opportunity to position itself as a “China-plus-one” alternative, this requires bringing federal institutions—particularly the states—on board. States should be part of discussions on manufacturing while negotiating trade agreements. Another approach is to leave the business of MSMEs to the states and incentivise those that deliver through financial allocations. A one-size-fits-all strategy does not work for manufacturing, particularly for MSMEs in India, as they are regionally and territorially embedded. There is a need for policies that bring states on board in MSME-related decision-making—possibly by establishing of an MSME Council or a National Manufacturing Council on the lines of the GST Council. Any economic policy thus requires multi-level coordination across governance units. Given India’s federal structure, it is all the more important that state-level policies align with those at the Centre.
Kalaiyarasan A. is an Associate Professor at Madras Institute of Development Studies (MIDS) and
Visiting Research Fellow at Kings College London.
Rhwithwik M. S. is a Research Associate at MIDS, and Research Scholar at the Gulati Institute of
Finance and Taxation, Trivandrum.
CEWC 2023
In December 2023, the CEWC gave nine priorities. They were: lead the construction of a modern industrial system with scientific and technological innovation; focus on expanding domestic demand; deepen reforms in key areas; expand high-level opening-up to the outside world; continuously and effectively prevent and resolve risks in key areas; persistently and diligently work on agriculture, rural areas, and farmers ('three rural issues'); promote the integrated development of urban and rural areas and regional coordination; seriously promote the construction of ecological civilization and green, low-carbon development; and effectively guarantee and improve people's livelihoods.
CEWC 2024
CEWC in 2024 retained the nine priorities but changed the order of the top three priorities. China has struggled with increasing the domestic consumption and therefore, prioritised it from second to first place. Technological innovation, which was top priority in 2023, was shifted to second place. Clearly China was to give more importance to innovation than GDP growth. In third place was deepening of reforms.
The messaging from this year’s politbureau meeting that took place on December 08, 2025 has changed from last year's "stability through progress" toward a focus on "improving quality and effectiveness” of such progress. The politbureau meeting reviewed the economic performance in three parts. First, it concluded that in 2025, China effectively implemented proactive and effective macro policies and economic and social development goals are expected to be achieved. Second, in the last five years (14th Five Year Plan Period), China effectively navigated challenges that resulted in enhancement of both hard and soft power1.
Third, it gave out three directions and eight priorities for economic work in 2026. The directions are: Next year's macroeconomic strategy will emphasise both coordination and forward planning; strengthen alignment between fiscal and monetary actions; balancing aggregate and structural policies2 and coordinating asset revitalisation with incremental stimulus. The difference from last year’s directions is that it is moving toward prioritising quality, effectiveness and sustainability of growth rather than the speed of expansion alone.
The eight key tasks for 2026 given by the politbureau are to persist in: Domestic demand as the mainstay to build a strong domestic market; innovation-driven development to strengthen new quality productive forces; tough reforms to enhance high-quality development; opening up to the outside world; coordinated development for urban-rural integration and regional linkage; guide “dual carbon” goals to promote comprehensive green transition; prioritise people’s livelihood for the masses; and hold the bottom line to actively and prudently resolve risks in key areas.
The CEWC confirmed politbureau meeting’s findings for the past year and the 14th Five Year Plan period. It then iterated the actions to achieve the eight priorities given in the Politbureau meeting. Application of New Development Philosophy3 to lay importance on high quality development led the pack of measures. Next came development of New Quality Productive Forces (新质生产) which means ‘advanced productivity that is characterised by ‘high-tech, high efficiency and high quality”. The third is to further develop a unified national market4 (全国统一市场). This concept though not new (was started in 2012), is not complete and has been facing hurdles from the provinces.
Under defusing risks in key areas, proactive fiscal policy, maintaining necessary fiscal deficit, continued austerity measures and a moderately loose monetary policy to keep ample liquidity are mentioned. Last year after the CEWC, the expectation was that China’s fiscal deficit may increase from 3% to 4%. In 2025, China’s fiscal deficit was at 4%. RMB exchange rate in 2026 is likely to remain stable. On the real estate sector that has been in trouble in China, there has been a mention in this year’s CEWC that China should stabilise the real estate sector and advance construction of “quality homes” indicating thereby, there have been instances of questionable standard in the construction sector.
Domestic consumption, which has been a worry for the last three years, has shown moderate increase at 4.6% in the first three quarters of 2025. It was US$ 30895 per capita for that period. However, in this year’s CEWC it was the first of the priorities. The change that has been brought this year is that in addition to domestic consumption there is an effort to unlock the service consumption by opening up the service sector in an orderly manner. Unemployment has been an issue for the past few years. This problem continues with 12.1 million students graduating this year and the unemployment rate hovering over 5%. Maintaining the birth rate has been another issue that China has been trying but has been unsuccessful so far.
Science and Technology Innovation has been given the importance that it deserves. Introduction of K Visa to attract talent alongside approximately 240 talent acquisition programmes at the central and provincial level running simultaneously is expected to give the impetus to this aspect. To assist in innovation driven development international technology innovation centres in Beijing (Beijing – Tianjin – Hebei Region), Shanghai (Yangtze River Delta) and Greater Bay Area (Guangdong – Hong Kong – Macao) will be established.
Efforts to address the involution6 in China’s economy has been going on for sometime. However, the mention in the CEWC about reforming State Owned Enterprises (SOEs) and promoting the private sector seems to be suspect. It is because in China, the SOEs are too big to fail and hence there has been a lot of support from the government. The Micro Small Medium Enterprises sector in China seems to have done better in 2025.
A few other issues have been highlighted: Developing Hainan Free Trade Port, facilitating integrated rural urban development and social issues like medical insurance payment, care and assistance for people in need, high quality One Belt One Road Cooperation all find a mention.
Three-year perspective
A comparison of priorities given in the CEWCs of the last three years is given below:
|
CEWC Priorities (2024–2026) |
||
|
2024 (Nine Priorities) |
2025 (Nine Priorities) |
2026 (Eight Priorities) |
|
Expand domestic demand (consumption + investment) |
“Seek progress while maintaining stability” as overarching principle |
Enhance foresight, precision, and coordination in policymaking |
|
Boost confidence of private sector |
Expand domestic demand (consumption + investment balance) |
Expand domestic demand with structural upgrades |
|
Stabilise the property market |
Stabilise growth, employment, prices, livelihoods |
Build a robust domestic market linked to 15th Five‑Year Plan |
|
Prevent and defuse financial risks |
Promote innovation-driven development (AI, semiconductors, biotech) |
Deepen supply-side reforms (productivity, efficiency) |
|
Promote technological innovation & self-reliance |
Deepen supply-side structural reforms |
Promote innovation & new growth drivers (digital economy, green tech) |
|
Advance green development & energy transition |
Guard against external risks (geopolitics, trade) |
Safeguard livelihoods & social stability |
|
Deepen SOE reform |
Strengthen food & energy security |
Strengthen risk prevention (property, debt, local finance) |
|
Strengthen employment & social welfare |
Improve business environment & private sector vitality |
Improve coordination between fiscal, monetary, and industrial policy |
|
Improve foreign trade & investment environment |
Advance green transformation & carbon goals |
|
Many of the problems that China is facing in its economy have not gone away. However, if one analyses the last three years approaches by China’s government, the slow graduation from recovery in 2024 to stability in 2025 and foresight and coordination in 2026 can be seen. Therefore, following can be expected in China’s economy in 2026:
- GDP Growth – 4.5% -5%
- Further stabilising of the real estate sector and regulation for quality housing
- A stable RMB around RMB b7 to a USD
- Fiscal Deficit of 4% to 4.5%
- Continued emphasis on innovation
- Continued efforts to increase domestic consumption and reduce unemployment
*****
Lt Gen SL Narasimhan is a Non-Resident Distinguished Fellow. The views expressed are those of the author and do not reflect the views of the Deccan Centre for International Relations (DCIR).
------------------------------------------
1. Hard Power is related to economy, science and technology and national defence while soft power refers to culture, diplomacy etc.
2. Aggregate policies imply fiscal and monetary stimulus, demand expansion and counter-cyclical adjustments and structural policies imply innovation-driven growth, supply-side optimisation, and cultivation of “new quality productive forces.
3. China's new development philosophy, introduced by Xi Jinping, shifts focus from rapid GDP growth to "high-quality development" centered on five core principles: Innovation, Coordination, Green Growth, Openness, and Sharing.
4. The concept of Unified national Market is to remove regional blockades and establish a nationwide open market system.
5. @1 USD =6.98 RMB
6. 内卷” (neijuan / involution) refers to a cycle of low-quality, harmful competition where firms or regions spend more and more on price cuts, subsidies, or replication of similar capacities without generating real growth, innovation, or returns. This reduces profits, raises costs, and weakens the broader economy.
Disclaimer: The views and opinions expressed in this article are those of the author(s) and do not necessarily reflect the official position of the Deccan Centre for International Relations.